
Cleveland Crime Map on One Live Timeline
Every police report that eight Cleveland-area departments publish, colored by how serious it was, on a map you can scrub through ten years of. Then stack the rest of what the county publishes on top of it: parcels and what they sold for, permits, calls for service, license-plate cameras. Free, no sign-up, and refreshed every night.
We built it to show what public data looks like when somebody takes the trouble to put it in one place. If your city, newsroom or firm has data like this, we build the same thing on yours.
The map itself is on this page. Best on a desktop. Reports are read from public police blotters and can lag the department by days; this is not an official source. Jump to the map.
Try it — the map, live
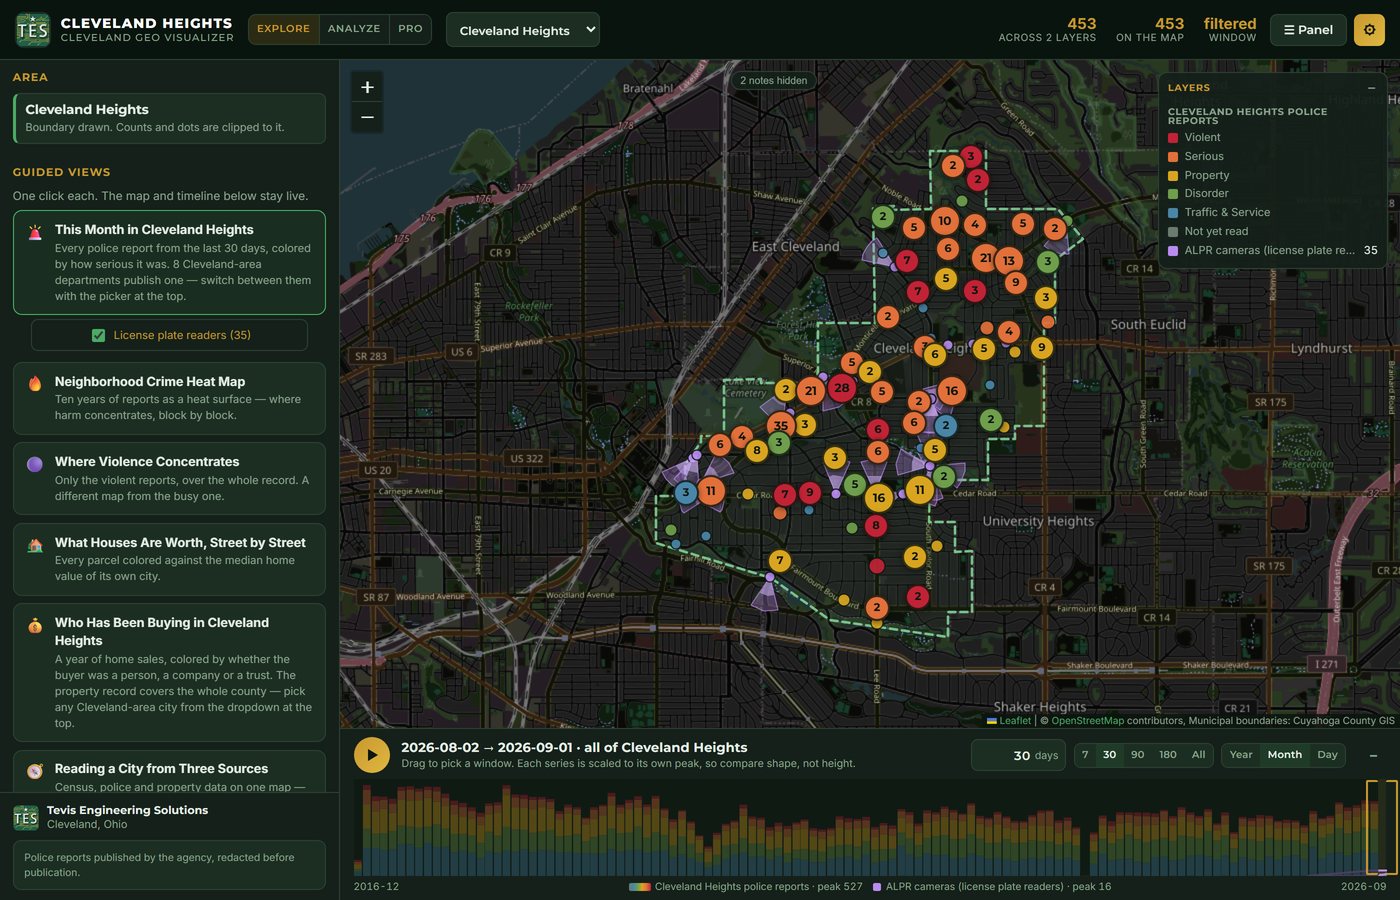
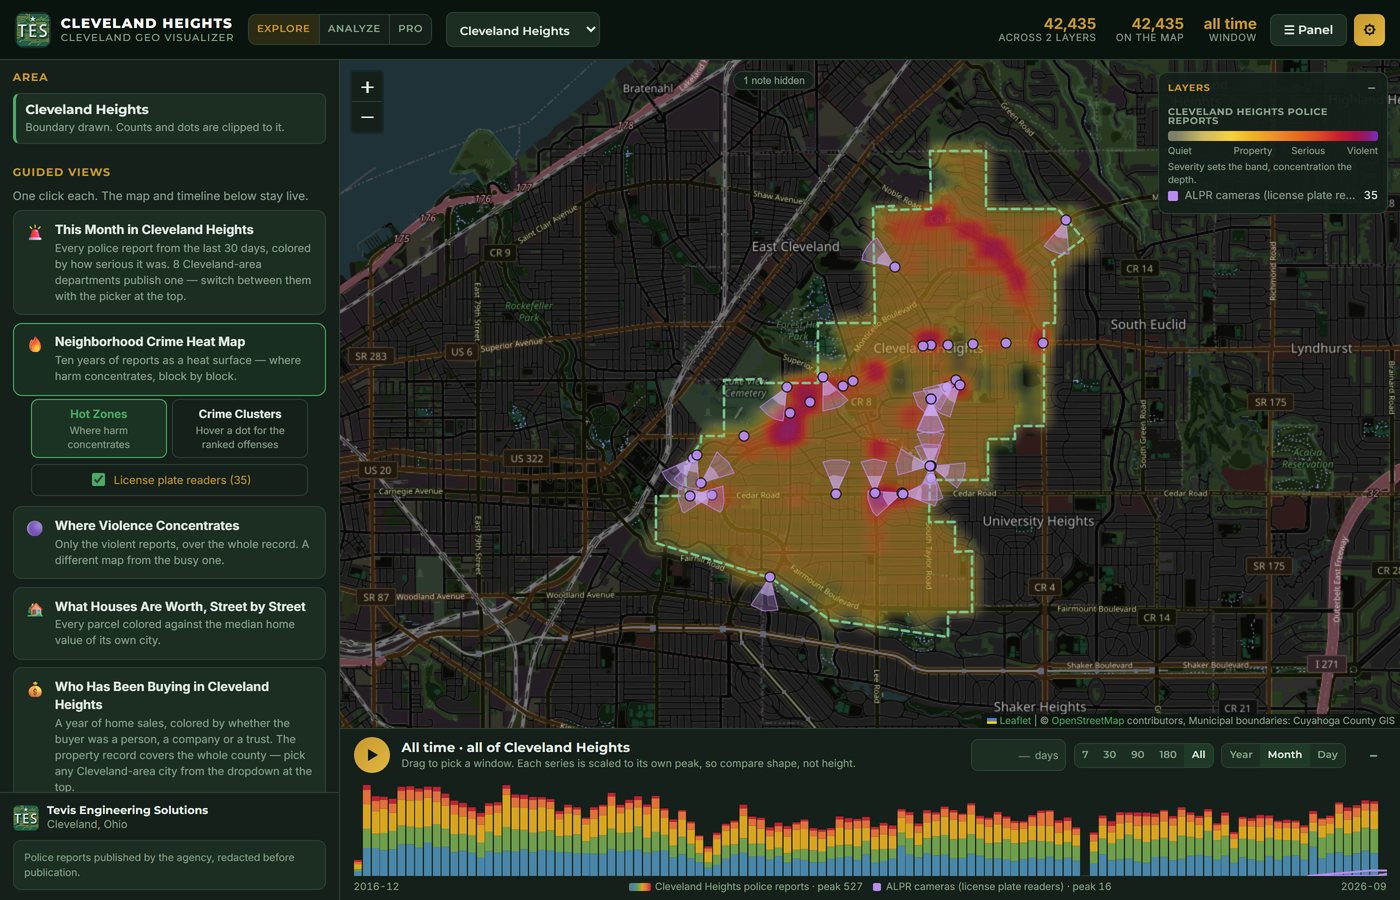
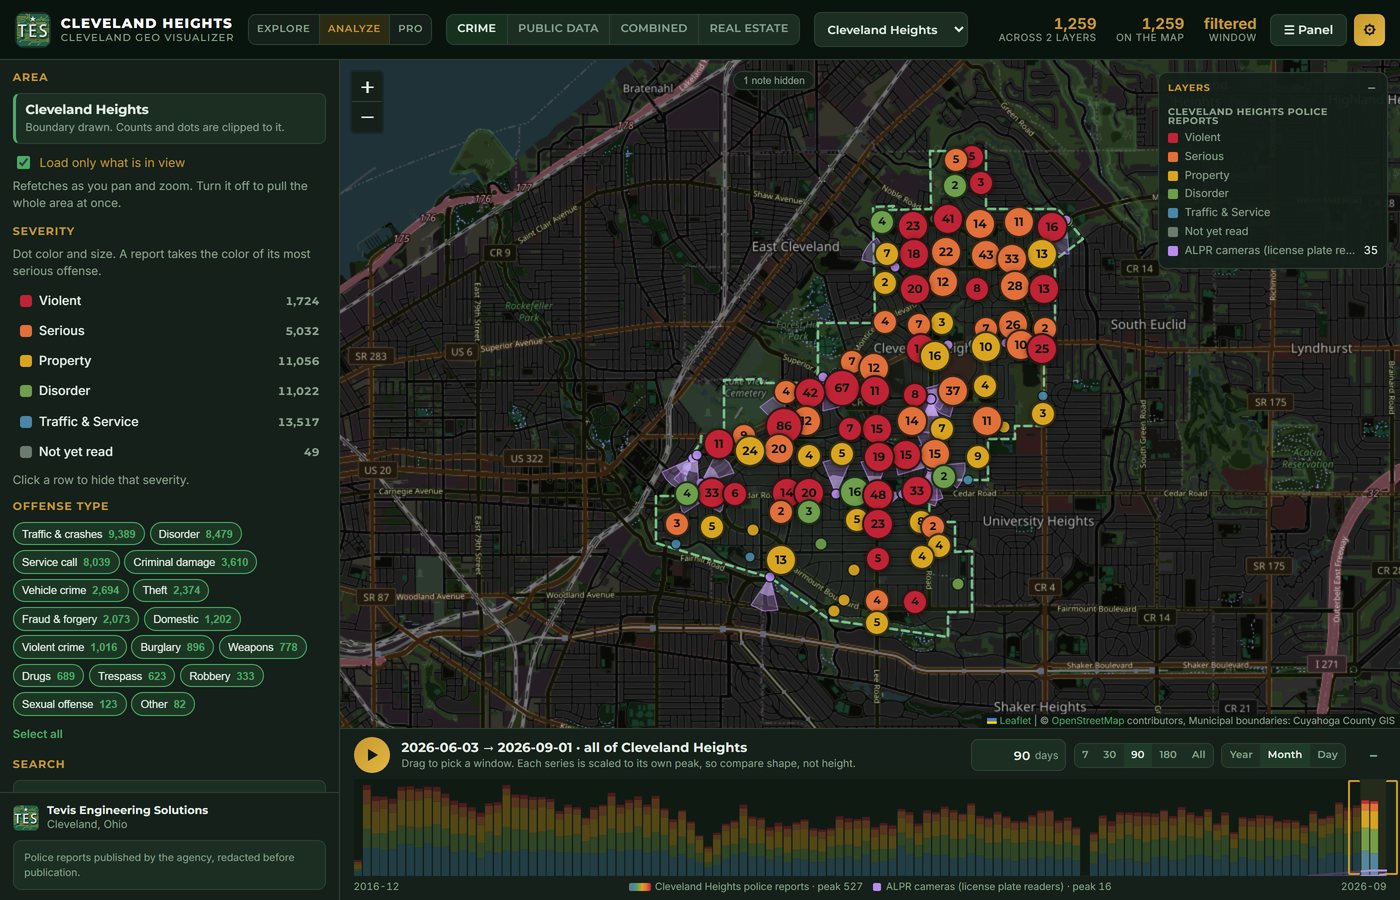
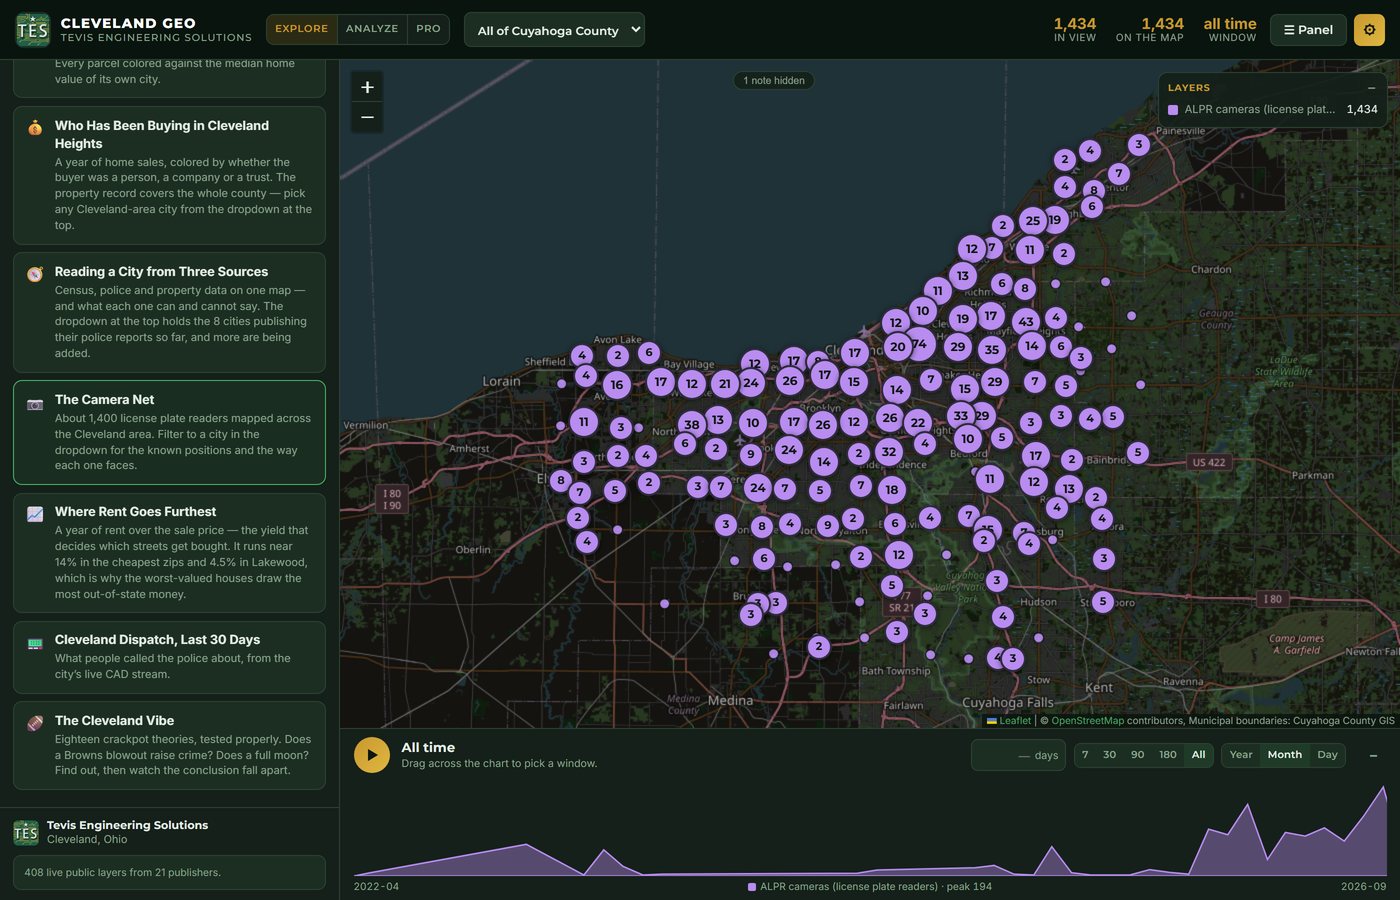
Pick a guided view on the left, drag the timeline at the bottom, or switch to Analyze and stack any of the county’s public datasets yourself. Click a cluster to read the report behind it.
What’s on the map
Police reports, by severity
Every published report from eight departments, each colored by its most serious offense: violent, serious, property, disorder, traffic and service. Ten years deep for Cleveland Heights. Search by street, offense, report number or officer.
The rest of the public record
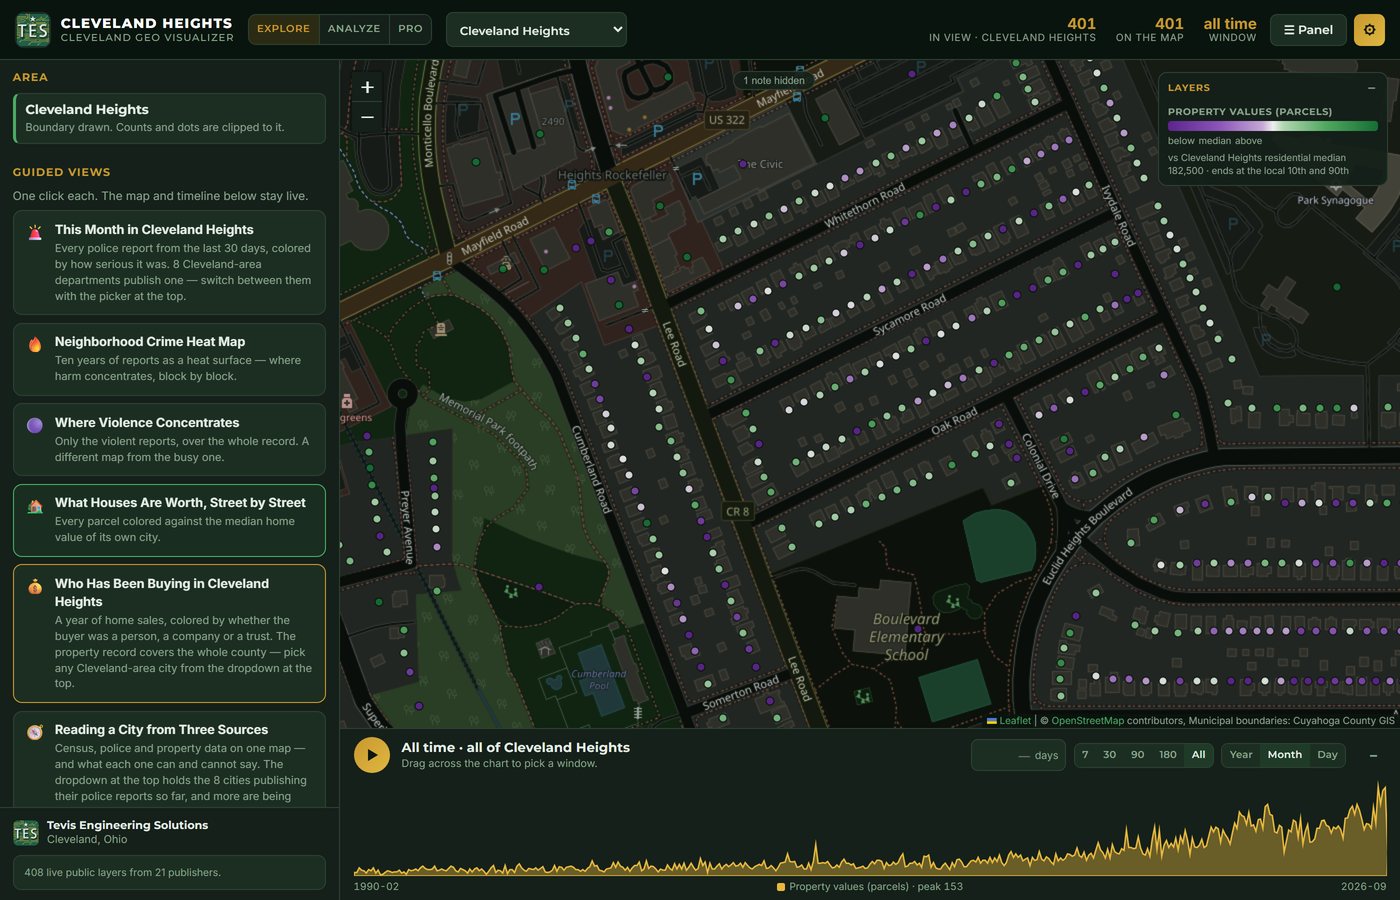
Parcels and what they sold for, building and demolition permits, the city’s live dispatch stream, license-plate readers, census context. Over four hundred live layers from twenty-one public publishers, fetched by your browser and never stored by us.
Three ways in
Explore is guided views with one click each. Analyze is the full stacking tool with a shared legend and timeline. Pro adds the workbench: correlation, repeat locations, overlap, exports.
Which departments are covered
Only departments that publish their reports to a public portal can be on the map, and only from the date their portal starts. This table is read from the live feed, so it says what the map says.
| Department | Reports mapped | Covered |
|---|---|---|
| Cleveland Heights | 42,908 | 2016-12 → 2026-09 |
| Euclid | 12,060 | 2014-01 → 2026-09 |
| North Olmsted | 6,640 | 2017-01 → 2026-08 |
| Shaker Heights | 3,072 | 2004-04 → 2026-09 |
| Richmond Heights | 2,331 | 2005-01 → 2026-03 |
| Solon | 1,900 | 2013-04 → 2026-01 |
| Parma Heights | 1,260 | 2021-01 → 2026-08 |
| North Randall | 625 | 2022-01 → 2026-09 |
70,796 reports across 8 departments. Feed built 2026-09-14.
How names and addresses are handled
The source is public. That does not make every detail in it something a map should repeat.
- Civilian names are never published. The portals print the names of people involved in crash reports. Those are private individuals who did not choose to be on a map, and the export strips them in every category.
- Some calls are withheld entirely. Medical transports, attempted suicide and death investigations are dropped from the public build, because their location would expose a private episode in a private home.
- Sensitive reports are shown at the block. Sexual-offense and domestic reports get a hundred-block address, 24XX Noble Rd, and a dot placed within about a hundred meters, never on the house.
- Officer names stay. They are the public acts of public employees, printed on a report the department itself publishes. That is a different thing from a victim’s address.
- Parcel owners are the county’s record. The owner of record on a parcel comes live from the county fiscal officer, the same as on the county’s own site, and is not stored by us.
- Something wrong? If a report on the map identifies someone it should not, use the form below with Report a data problem and it will be looked at that day.
The same engine, on your data
Nothing here is specific to crime. The map reads any open-data service, puts it on a shared timeline, and stacks it with everything else. What changes is whose data, and what question it is built to answer.
Cities and counties
An open-data portal residents actually use. Permits, code cases, service requests and dispatch on one map, on your own domain, with the privacy rules written down and enforced in the export.
Newsrooms
An embeddable, self-updating map for a beat: crime, housing, development. Guided views written for the story, the raw layers one click below them, and a data feed your readers can check.
Realtors and investors
Parcels against the local median, a year of sales colored by who bought them, tax-delinquency and appeal candidates, rent yield by street. The property record for a whole county, filtered to a block.
Law firms
Crash and incident geography by corridor and by month, with the public record behind each dot. Where the same intersection keeps coming up, and when.
Community groups
A neighborhood’s own view of its own data, kept current without anyone maintaining a spreadsheet. Print a month for the meeting; link the map for everyone who could not come.
You own it
A fixed-price build you keep, or a hosted service we run. No per-seat licensing, no per-view metering. The feed format is documented so your data is never locked inside our tool.
How a custom build works
We find what your city, county or agency already publishes, what it would take to read it, and what in it must not reach a map. You get that in writing before anything is built.
Which fields, at what precision, refreshed how often, with which categories masked or withheld. The rules this map runs on, adapted to yours.
The map, the guided views written for your questions, and an export that refuses to publish anything the contract forbids. Checked twice, by two separate audits, before every refresh.
On your domain, refreshing on its own with no one on duty. Yours to keep, or ours to run for you, with an alert to a human only when something breaks.
Common questions
Is this an official crime map?
Where does the data come from?
How current is it?
Why do some reports show a block instead of an address?
Why are officer names shown?
Can I embed the map or get the data?
Can you build something like this for us?
Build one for your city, newsroom or firm
Tell us whose data it is and the question it should answer. We will look at what is already published, show you what it would look like on the map, and come back with a fixed number. Straight to the engineer, one-business-day reply.